www.buildingsandcities.org/insights/news/digital-tools-building-stocks.html
New digital tools created for building stocks and cities
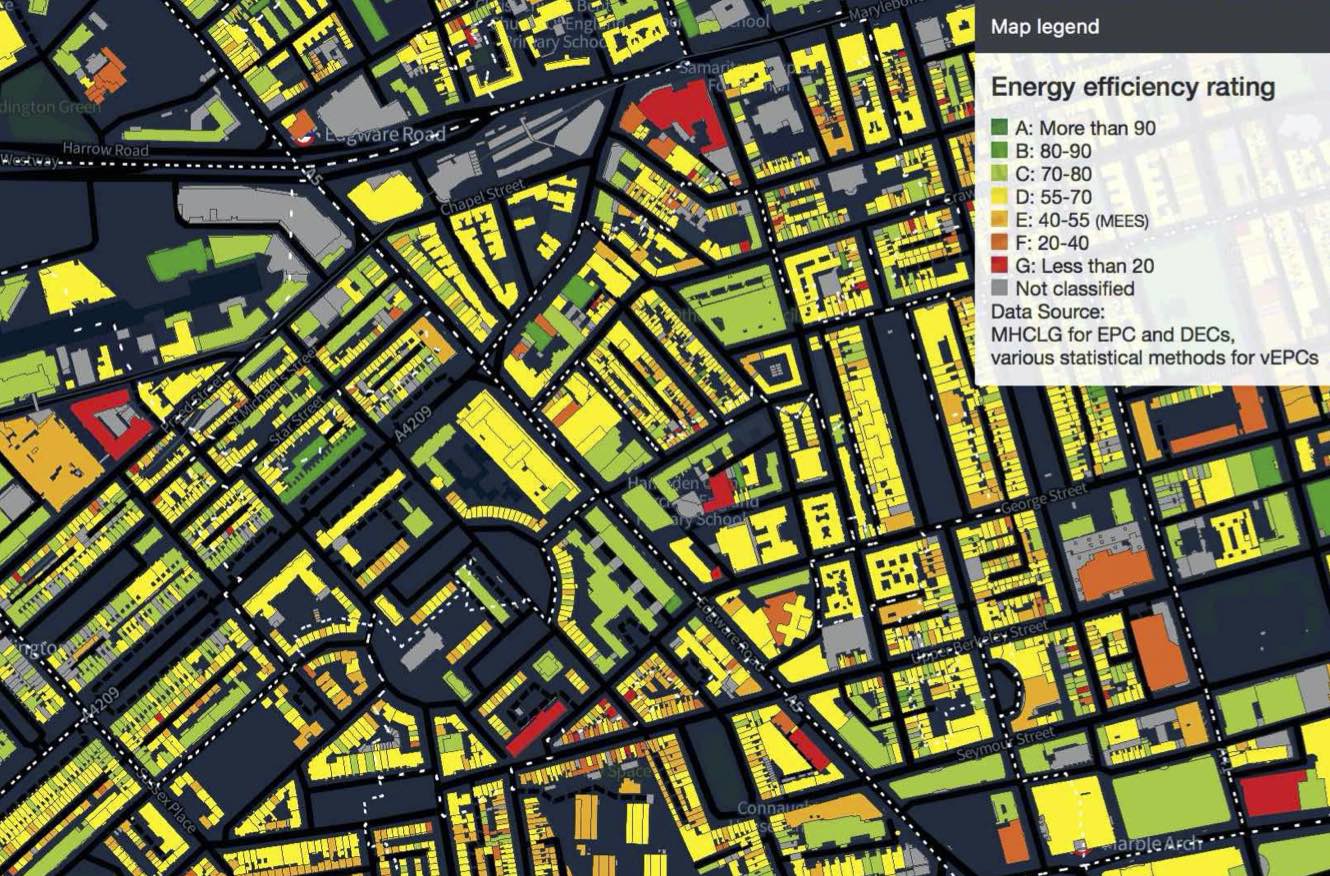
This 3D 'digital twin' for London can be used for the monitoring, simulation and analysis of the building stock - for improving energy efficiency, reducing fuel poverty and targetting retrofit strategies.
This is a world first for digital twins - an interactive model containing rich data on a city's buildings and their energy use. The Greater London Authority (GLA) have launched two new digital tools to support efforts towards making the capital's building stock carbon neutral by 2050. These are the London Building Stock Model and the London Solar Opportunity Map. The Model shows how cities can harness and effectively combine data to enhance their policy and deliver appropriate strategies.
The London Building Stock Model contains detailed data on every separate domestic and non-domestic building in the 33 Boroughs of Greater London. These add up to some 1.5 million houses, 1.9 million flats, and around 250,000 non-domestic premises. The Model includes three-dimensional information about buildings including their heights, volumes and wall areas, as well as the nature of the activities of the occupants on each floor. Other data are attached on the ages of buildings, their materials of construction, and (in some cases) their servicing systems. Energy Performance Certificates (EPCs) and Display Energy Certificates are attached to dwellings and premises, and those which lack Certificates are assigned 'virtual EPCs' estimated statistically in each case from a building's characteristics and location. The Model provides a snapshot for 2017 and will be updated annually. The background to the Model's development was decribed in a recent article in Buildings & Cities: https://doi.org/10.5334/bc.52 .
The Model is being used by the GLA and London Boroughs to tackle fuel poverty and improve the energy efficiency of the capital's building stock. It allows poorly performing dwellings and non-domestic buildings to be identified. It supports Boroughs in their enforcement of the Minimum Energy Efficiency Standard. Programmes of retrofits to achieve net zero carbon emissions by 2050 or earlier can be planned and evaluated.
The Model has been supplied in two versions, both in 2D map form, accessed via web interfaces. The first, for the GLA and Boroughs, has a powerful analytical tool with which graphs, charts and tabular outputs can be produced. The second version is public and is intended for use by householders, property owners, businesses and community groups to make energy improvements to their premises and reduce their energy bills. It can be accessed at
https://www.london.gov.uk/what-we-do/environment/energy/energy-buildings/london-building-stock-model
The London Solar Opportunity Map shows the energy potentially available, either electricity from photovoltaic (PV) installations or heat from thermal collectors, on all roofs and areas of open land for the whole of the capital out to the M25 motorway. It is based on a 3D model of terrain, buildings, other structures and trees derived from LiDAR - laser measurements made from overflying aircraft. The Map will help London to achieve the Mayor's targets of 1 gigawatt of installed solar power by 2030, and 2 gigawatts by 2050.
Calculations are made of the amounts of direct and diffuse solar radiation falling annually on all surfaces, taking account of overshadowing by neighbouring buildings and trees. From these figures, the solar energy potential is estimated, allowing for the slopes of roofs and for different solar technologies. A minimum threshold is set, below which installations are likely to be uneconomic. The character of land surfaces and their suitability for solar are represented in the Map: some areas such as roads, woodlands and Royal Parks are excluded. The Map is linked to the London Building Stock Model, which makes it possible to know the uses and potential reductions in other energy use if solar panels were installed.
Besides policy making by the GLA, it is intended for householders, building owners, solar installers, and investors in solar power. Data are included in the Map on some 100 megawatts of existing solar installations. Early analysis of the Map shows that around a quarter of the Mayor's 2-Gigawatt target could be met with PV on the roofs of 4000 large warehouses. Alternatively, the entire 2Gw could be achieved with installations on a third of a million houses, the majority of them built before 1939.
The Map is made available through a web interface at https://www.london.gov.uk/what-we-do/environment/energy/energy-buildings/london-solar-opportunity-map
Both the Model and the Map are very data-intensive, and respond faster with the Chrome or Firefox browsers, and via a cable rather than wireless internet connection.
The tools have been developed by the Energy Institute and the Centre for Advanced Spatial Analysis at University College London. The members of the teams responsible for the tools are Stephen Evans, Rob Liddiard, Daniel Godoy-Shimizu, Dominic Humphrey, Ivan Korolija, Gareth Simons, Paul Ruyssevelt and Philip Steadman.


Latest Peer-Reviewed Journal Content

Negotiating net-zero carbon: an ANT analysis of two buildings
L Schweber & M Green
Design for disassembly: a review of public policy proposals
O Vorobjev, U Uotila, T Joensuu & A Saari
Retrofitting Norwegian residential buildings: an archetype-based dynamic stock model
L S A Rousseau, S Amini, S Akin & E G Hertwich
Decolonising time: vernacular villages and the politics of heritage temporality
R Al-Rabady
Commutes to alternative workplaces: GHG emissions and physical activity
J Taylor, L Thoen, A Espinosa Mireles De Villafranca, P Anashin, J Vanhatalo, D Milián
Bernal & I Okkonen
Nine ‘myths’ about the building stock of Great Britain
S Evans, P Steadman, A Neto-Bradley, D Humphrey, R Liddiard,H Shamsi, J Palmer & G Simons
Critical Reconstruction Theory and the invention of post-disaster response
G Lizarralde, D Wachsmuth, F Özdoğan & M Cossu
Post-war reconstruction-as-knowledge practice: Fukui’s dual disaster recovery
A Y F Urushima & K Yamaguchi
Critical reflections on the process of interdisciplinary building science research
G T Morgan, M F Touchie, J Robinson, A Jakubiec & J Tran
Comparing technical disassembly potential methods for concrete and timber buildings
N Westerholm, A Tuure, S Pajunen & M Kuittinen
One-stop shops as leverage points for renovation sufficiency
G Pardalis & M Sula
Creating resilient cities: advocacy and planning for equity-based recovery
A Paidakaki
Impact of glazed balcony design on daylight in Finnish apartments
L Jegard, R Castaño-Rosa & S Pelsmakers
Climate-related risks: implications for municipal governments in Brazil
C Nastari Fernandes, P Ciminelli Ramalho & F Lima-Silva
Changing land-use metrics in mass housing: Türkiye case study
M S Çepni, A K Kutluca, T Salihoğlu, A Atmaca & S Mintemur
Personal comfort systems for adults with intellectual disabilities
K Exss, M Trebilcock, P Wegertseder-Martínez, S Schiavon & H Zhang
How buildings shape occupant movement: a systematic review and framework
G Chinazzo & N Wang
Rethinking the second life of post-disaster and post-conflict temporary housing
N Akdede, B Ö Ay & İ Gürsel Dino
Embodied carbon impacts of residential development siteworks: new assessment framework
P Comerford, O Kinnane, R O’Hegarty & P Crowe
Horizontal building extensions: potential in Finnish blocks of flats
J Tarpio & P Lehtovuori
Post-disaster reconstruction and ethics: the power of social capital
B Ubesingha, G Ofori, G Agyekum-Mensah & D Frings
Towards net zero: sectoral ambitions and global trends in building decarbonisation
C E Caballero-Güereca, J Vogel, N Alaux, C M Ouellet-Plamondon, J Silva Santana, G Foliente, T Lützkendorf & A Passer
Climate literacy and labour agency in vocational education and training
J Calvert, V Price, C Winch, L Clarke, M Sahin-Dikmen, P-L Bilodeau & E Dionne
Towards a new neighbourhood-scale climate risk-adaptation approach
C Rigoni, S Oliveira, O Romice, A Moreno-Rangel & A Chatzimichali
Sharing energy renovations know-how through citizen–professional knowledge networks
C Foulds, S Royston, A Aggeli, A Crowther & R Robison
Environmental impacts of reclaimed bricks: comparing different deconstruction methods
E Salmio & S Huuhka
eCOMBINE: framework for energy, comfort, behaviour and a multi-domain environment
V M Barthelmes, C Karmann, V Gonzalez Serrano, K Lyu, J Wienold, M Andersen, D Licina & D Khovalyg
Living labs as ‘agents for change’ [editorial]
N Antaki, D Petrescu & V Marin
Join Our Community

The most important part of any journal is our people – readers, authors, reviewers, editorial board members and editors. You are cordially invited to join our community by joining our mailing list. We send out occasional emails about the journal – calls for papers, special issues, events and more.
We will not share your email with third parties. Read more
Latest Commentaries
Remote Sensing for Urban Development Policies
At the 2026 Sustainable Buildings and Construction Summit Magnus Andersson, David Muthui & Reza Roodaki (Malmö University) argued that remote sensing should be a core evidence infrastructure for sustainable urban governance. Satellite derived and geospatial analysis can observe and monitor urban expansion, densification, land consumption, building form and material demand across jurisdictions and over time. A shift from two-dimensional to three-dimensional sensing and analysis provides new data to inform policies for housing, land-use efficiency, disaster exposure, public space, resource efficiency and resilient construction.
Disaster Reconstruction: Practitioner Insights Improve Outcomes
Regan Potangaroa (Auckland University of Technology - AUT), Kelvin Zuo (Massey University), Suzanne Wilkinson (AUT) explain why experience-led knowledge from the field, when triangulated with contemporaneous documentation, can constitute evidence for understanding post-disaster reconstruction systems. People working within reconstruction environments (engineers, builders, logisticians and community actors) provide crucial observations about how reconstruction systems function in practice, particularly supply chains, material flows, procurement and governance in post-disaster rebuilding. Integrating this knowledge can lead to better outcomes.