www.buildingsandcities.org/insights/research-pathways/harnessing-spatial-data.html
Harnessing the Power of Spatial Data
RESEARCH PATHWAY: personal reflections on a career in research
Polly Hudson (Alan Turing Institute) explains how her curiosity about planning knowledge and local community engagement led to new ways to capture and represent 2D, 3D and 4D spatial data about building stocks and urban form. New challenges arise for creating dynamic urban models and platforms: promoting public participation and understanding, use as a planning tool, combining diverse data sources, and simulating the behaviour of building stocks over time.
At university, I studied art and architectural history, although I was always much more interested in learning about how and why places were built, than in artists' and architects' lives. This experience encouraged me to ask questions about the process by which ordinary buildings are produced, and the reasons for their construction and form. My interest, as a designer and researcher, is how to create inclusive, interesting, accessible and useful resources on building stocks. This entails harnessing the skills and knowledge from many types of audience.
I grew up in a family involved in medical research which exposed me to the value of international collaboration in scientific research. An important influence was the connection between the diagnosis / treatment of disease and the technological innovation in microscopy that advanced the understanding of biological systems. Realising how buildings could be studied like 'cells' using Geographic Information Systems (GIS) was a major turning point in my career. The capture of spatial statistics at cell level on the composition, dynamics and operation of stocks is necessary to understand urban systems. This led to a particular interest in building footprints, both as graphic representations of building 'cells', past and present, as geospatial filing cabinets through which diverse types of data can be collated, and as attributes from which other characteristics can be inferred. The Periodic Table and its use of simple 2D graphic to infer properties, structure and reactions of the chemical elements make data has been another source of inspiration. Could the possibilities offered by graphic representation be used to forecast the future dynamic behaviour of stocks?
In 1995 I took a part time job looking at planning applications on behalf of a local conservation group. I decided to produce coloured maps showing the age of buildings in that district, finding it inexplicable that maps of this kind did not already exist. I was also struck by planners' lack of interest in residents' views on planning applications or in the impacts of demolition on local communities, when so much knowledge on how local areas operate over time is held by these communities and conservation groups.
I initiated The Building Exploratory charitable trust in London to harness and visualise community knowledge about building stocks. This involved a process of co-creation with local stakeholders to produce a model of local building stocks for free public exhibitions/resource centres, which combined physical and digital tools. This brought together expertise from the arts, humanities and science to explore building construction and design, performance and history. Here I also began to explore the use GIS, and data animations, as a means to rapidly convey information on buildings to the public. Providing users with the ability to zoom down on their homes and access current and historical maps, aerial photography, and streetview images at building level was found to be of exceptional interest to visitors (tested before Google maps became available). Since this time my work has largely focused on the development of spatial data visualisations as a powerful, efficient way to support public engagement in sustainable development.
Experimentation with Steve Evans in the early 2000s, before collaborating again at University College London (UCL), resulted in several projects which informed later work including a 3D digital animation of the demolition and construction of all buildings in a 1km2 area of London, between 1750 and 2010 and an animated history of fossil fuel use in the UK.
In 2014 I commenced a PhD at UCL,
initially to look at methods for tracking demolition in the UK. This multidisciplinary
academic environment exposed me to an incredibly diverse range of expertise. However,
owing to lack of availability of basic data to answer my research question, I instead
began to explore the methods and technologies that could capture and visualise data
on demolition, and on the composition, quality and short- and long-term
dynamics of the building stock. This involved experimenting with the use
of building footprint data to help harness and share knowledge. The goal was to
allow the public and other stakeholders to see and become involved with building
attribute data capture and visualisation for UK cities at cell level, and to
seamlessly interlink information on stock composition, performance and dynamic
behaviour. 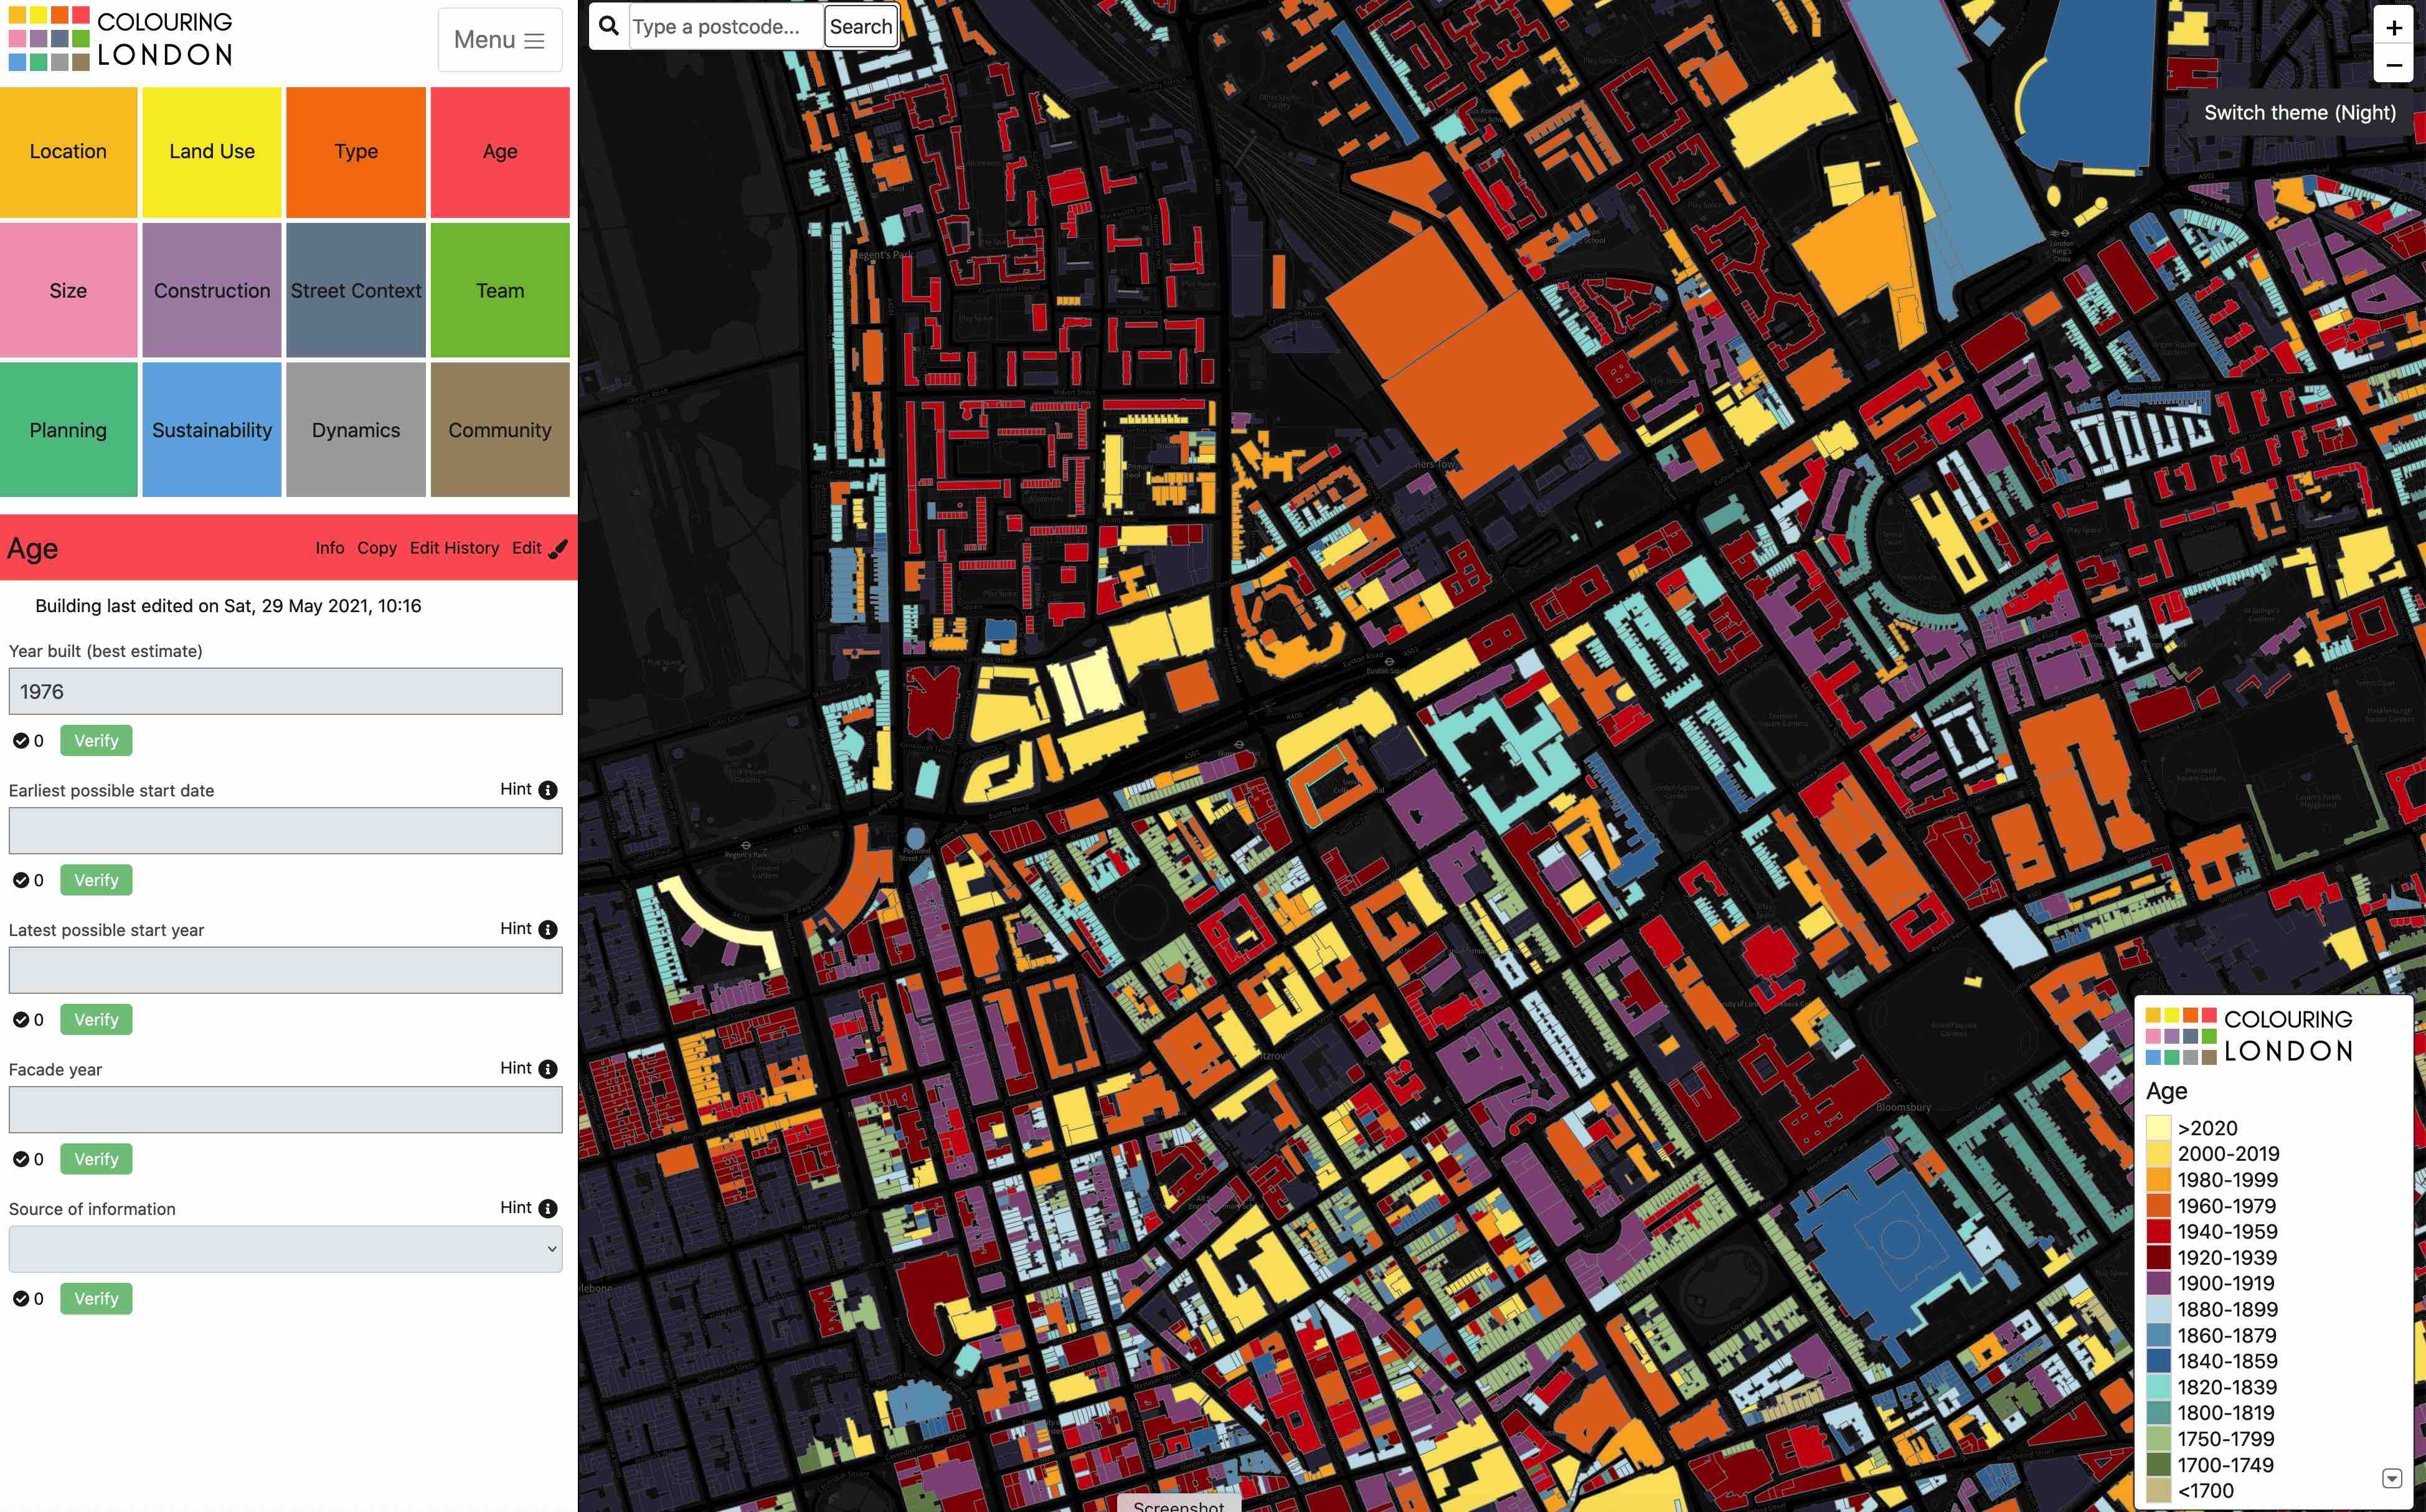
As part of my PhD I began to work on the development the Colouring London prototype platform, collaborating with Tom Russell, the project's technical architect. The idea was to integrate tools, ethical frameworks and crowdsourcing mechanisms, with the co-creation model and ethical framework developed at the Building Exploratory. This also afforded opportunities to develop an open platform involving multiple sectors, disciplines and stakeholders in supporting the scientific analysis of stocks. Many possible applications for proposed attribute data were identified (e.g. improved retrofit targeting, performance tracking of development teams, more accurate calculations of energy and waste flows, greater transparency within the planning system). However, the initial focus was mainly on the ability of the platform to capture high quality age data for typology location and energy analysis.
Questions began to arise on how a sufficient quality and volume of (current and historical) microspatial data could be produced in order to understand the stock as a complex dynamic system, and to detect underlying rules of operation within stocks. Automated and crowdsourced methods of data capture therefore started to be tested as well as feedback loops between these. These include mechanisms that enable humanities experts to easily translate text-based information and unrecorded knowledge into spatial statistics for scientific use.
The Colouring London project moved to the Alan Turing Institute in 2020 becoming The Colouring Cities Research Programme (CCRP). Its remit is to promote the efficient reproduction of open-source platform code by international academic partners to maximise the volume and quality of building attribute data available at global level. We currently work with an international cohort of academic colleagues to test code across countries, share software engineering skills and knowledge on different aspects of the stock. The goal is to improve the effectiveness and efficiency of platforms.
Challenging questions that still need to be addressed include:
- How can the ease of reproducibility of open code be improved to maximise access - especially for countries with limited funds and research software engineering expertise?
- How can the development of core-code and interface design allow countries to co-work on the analysis of captured data?
- How can this be done in a way that also promotes high standards of data ethics?
- How can the process of producing high quality, large-scale datasets be accelerated? Can feedback loops between automated data capture and crowdsourced contributions be designed to ensure the efforts of contributors are not automatically overwritten?
- How can data be captured on short- and long-term dynamics for use by digital twins that can simulate the demolition and construction of buildings over time?
- How can Colouring Cities data be used to explore underlying spatio-temporal patterns, rules and cycles operating with stocks, and across countries?
- How can 4D visual databases be developed for cities while protecting the current and future privacy and security of citizens?


Latest Peer-Reviewed Journal Content
Negotiating net-zero carbon: an ANT analysis of two buildings
L Schweber & M Green
Design for disassembly: a review of public policy proposals
O Vorobjev, U Uotila, T Joensuu & A Saari
Retrofitting Norwegian residential buildings: an archetype-based dynamic stock model
L S A Rousseau, S Amini, S Akin & E G Hertwich
Decolonising time: vernacular villages and the politics of heritage temporality
R Al-Rabady
Commutes to alternative workplaces: GHG emissions and physical activity
J Taylor, L Thoen, A Espinosa Mireles De Villafranca, P Anashin, J Vanhatalo, D Milián
Bernal & I Okkonen
Nine ‘myths’ about the building stock of Great Britain
S Evans, P Steadman, A Neto-Bradley, D Humphrey, R Liddiard,H Shamsi, J Palmer & G Simons
Critical Reconstruction Theory and the invention of post-disaster response
G Lizarralde, D Wachsmuth, F Özdoğan & M Cossu
Post-war reconstruction-as-knowledge practice: Fukui’s dual disaster recovery
A Y F Urushima & K Yamaguchi
Critical reflections on the process of interdisciplinary building science research
G T Morgan, M F Touchie, J Robinson, A Jakubiec & J Tran
Comparing technical disassembly potential methods for concrete and timber buildings
N Westerholm, A Tuure, S Pajunen & M Kuittinen
One-stop shops as leverage points for renovation sufficiency
G Pardalis & M Sula
Creating resilient cities: advocacy and planning for equity-based recovery
A Paidakaki
Impact of glazed balcony design on daylight in Finnish apartments
L Jegard, R Castaño-Rosa & S Pelsmakers
Climate-related risks: implications for municipal governments in Brazil
C Nastari Fernandes, P Ciminelli Ramalho & F Lima-Silva
Changing land-use metrics in mass housing: Türkiye case study
M S Çepni, A K Kutluca, T Salihoğlu, A Atmaca & S Mintemur
Personal comfort systems for adults with intellectual disabilities
K Exss, M Trebilcock, P Wegertseder-Martínez, S Schiavon & H Zhang
How buildings shape occupant movement: a systematic review and framework
G Chinazzo & N Wang
Rethinking the second life of post-disaster and post-conflict temporary housing
N Akdede, B Ö Ay & İ Gürsel Dino
Embodied carbon impacts of residential development siteworks: new assessment framework
P Comerford, O Kinnane, R O’Hegarty & P Crowe
Horizontal building extensions: potential in Finnish blocks of flats
J Tarpio & P Lehtovuori
Post-disaster reconstruction and ethics: the power of social capital
B Ubesingha, G Ofori, G Agyekum-Mensah & D Frings
Towards net zero: sectoral ambitions and global trends in building decarbonisation
C E Caballero-Güereca, J Vogel, N Alaux, C M Ouellet-Plamondon, J Silva Santana, G Foliente, T Lützkendorf & A Passer
Climate literacy and labour agency in vocational education and training
J Calvert, V Price, C Winch, L Clarke, M Sahin-Dikmen, P-L Bilodeau & E Dionne
Towards a new neighbourhood-scale climate risk-adaptation approach
C Rigoni, S Oliveira, O Romice, A Moreno-Rangel & A Chatzimichali
Sharing energy renovations know-how through citizen–professional knowledge networks
C Foulds, S Royston, A Aggeli, A Crowther & R Robison
Environmental impacts of reclaimed bricks: comparing different deconstruction methods
E Salmio & S Huuhka
eCOMBINE: framework for energy, comfort, behaviour and a multi-domain environment
V M Barthelmes, C Karmann, V Gonzalez Serrano, K Lyu, J Wienold, M Andersen, D Licina & D Khovalyg
Living labs as ‘agents for change’ [editorial]
N Antaki, D Petrescu & V Marin
Join Our Community

The most important part of any journal is our people – readers, authors, reviewers, editorial board members and editors. You are cordially invited to join our community by joining our mailing list. We send out occasional emails about the journal – calls for papers, special issues, events and more.
We will not share your email with third parties. Read more
Latest Commentaries
Remote Sensing for Urban Development Policies
At the 2026 Sustainable Buildings and Construction Summit Magnus Andersson, David Muthui & Reza Roodaki (Malmö University) argued that remote sensing should be a core evidence infrastructure for sustainable urban governance. Satellite derived and geospatial analysis can observe and monitor urban expansion, densification, land consumption, building form and material demand across jurisdictions and over time. A shift from two-dimensional to three-dimensional sensing and analysis provides new data to inform policies for housing, land-use efficiency, disaster exposure, public space, resource efficiency and resilient construction.
Disaster Reconstruction: Practitioner Insights Improve Outcomes
Regan Potangaroa (Auckland University of Technology - AUT), Kelvin Zuo (Massey University), Suzanne Wilkinson (AUT) explain why experience-led knowledge from the field, when triangulated with contemporaneous documentation, can constitute evidence for understanding post-disaster reconstruction systems. People working within reconstruction environments (engineers, builders, logisticians and community actors) provide crucial observations about how reconstruction systems function in practice, particularly supply chains, material flows, procurement and governance in post-disaster rebuilding. Integrating this knowledge can lead to better outcomes.